Introduction: The Urgency of Climate Action
In an era where the consequences of climate change are becoming increasingly evident—from rising sea levels to more frequent and severe weather events—the need for effective monitoring and mitigation strategies is more pressing than ever. Among the most significant contributors to climate change are greenhouse gases, particularly carbon dioxide (CO₂) and methane (CH₄). These gases trap heat in the Earth’s atmosphere, leading to global warming and a host of related environmental issues.
Traditionally, tracking these emissions has relied on ground-based monitoring systems. While effective in localized areas, these systems are limited in scope and often fail to capture the full picture of global emissions. This is where satellite imagery and Geographic Information Systems (GIS) come into play. These technologies offer a comprehensive, real-time approach to tracking emissions, providing critical data that can inform policy decisions, corporate strategies, and international agreements.
Understanding the Role of Satellite Imagery in Emission Tracking
Satellite imagery refers to the images and data captured by satellites orbiting the Earth. Over the past few decades, satellite technology has advanced to the point where we can now monitor various aspects of our planet with incredible detail and accuracy. When it comes to tracking greenhouse gas emissions, satellites equipped with specialized sensors can detect and measure the concentration of gases like CO₂ and CH₄ in the atmosphere.
How Satellite Sensors Work
Satellite sensors operate by detecting the specific wavelengths of light that are absorbed and emitted by different gases. For example, carbon dioxide and methane absorb infrared light at specific wavelengths. By measuring the amount of light absorbed at these wavelengths, satellite sensors can estimate the concentration of these gases in the atmosphere.
There are several types of satellite sensors used for this purpose, including:
- Hyperspectral Sensors: These sensors capture data across a wide range of wavelengths, providing detailed information about the chemical composition of the atmosphere. Hyperspectral imagery is particularly useful for identifying and quantifying greenhouse gases.
- Thermal Infrared Sensors: These sensors measure the thermal radiation emitted by the Earth’s surface and atmosphere. Since greenhouse gases like CO₂ and CH₄ absorb and emit thermal radiation, these sensors can be used to detect and measure their concentrations.
- Lidar (Light Detection and Ranging): Lidar systems use laser pulses to measure the distance to a target, allowing them to create detailed 3D maps of the Earth’s surface. When used in combination with other sensors, Lidar can help detect methane leaks from oil and gas infrastructure.
Advantages of Satellite-Based Emission Monitoring
The use of satellite imagery for tracking carbon and methane emissions offers several key advantages over traditional ground-based methods:
- Global Coverage: One of the most significant benefits of satellite-based monitoring is its ability to provide comprehensive, global coverage. Unlike ground-based sensors, which are limited to specific locations, satellites can monitor emissions from even the most remote and inaccessible regions of the Earth. This global perspective is crucial for understanding the full extent of greenhouse gas emissions and their impact on the environment.
- High-Resolution Data: Modern satellites are capable of capturing high-resolution images, allowing for the precise identification of emission sources. This level of detail is essential for pinpointing specific locations where emissions are occurring, whether it’s a methane leak from an oil field or carbon dioxide emissions from a coal-fired power plant.
- Real-Time Monitoring: Satellites continuously collect data as they orbit the Earth, enabling real-time monitoring of greenhouse gas emissions. This is particularly important for responding to sudden changes or unexpected events, such as a spike in emissions due to an industrial accident or a natural disaster.
- Long-Term Data Collection: Satellites have the ability to collect data over extended periods, making it possible to track changes in emission levels over time. This long-term perspective is essential for assessing the effectiveness of environmental policies and identifying trends that may require further investigation.
The Integration of GIS for Enhanced Analysis
While satellite imagery provides the raw data needed to track greenhouse gas emissions, GIS is the tool that transforms this data into actionable insights. Geographic Information Systems (GIS) are software platforms that allow users to capture, store, analyze, and visualize spatial data. When combined with satellite imagery, GIS enables a deeper understanding of the spatial and temporal patterns of emissions.
Key GIS Capabilities for Emission Tracking
- Spatial Analysis: GIS allows for the analysis of spatial relationships between different data layers. For example, by overlaying satellite data on a map of industrial facilities, researchers can identify which facilities are contributing the most to local emissions. This type of analysis is crucial for targeting emission reduction efforts where they are most needed.
- Temporal Analysis: In addition to spatial analysis, GIS also supports temporal analysis, enabling the study of how emissions change over time. By comparing satellite data from different time periods, GIS can reveal trends and patterns in emission levels. This information is valuable for evaluating the impact of regulatory measures, changes in industrial practices, or natural phenomena such as wildfires.
- Predictive Modeling: One of the most powerful applications of GIS is its ability to create predictive models. By integrating satellite data with other environmental variables, such as temperature, wind patterns, and land use, GIS can generate models that predict future emission levels under different scenarios. These models are essential for long-term planning and policy development.
- Visualization and Communication: GIS is also a powerful tool for visualizing and communicating complex data. By creating maps, graphs, and other visual representations, GIS makes it easier for policymakers, stakeholders, and the general public to understand the spatial and temporal dynamics of greenhouse gas emissions. Effective communication is key to driving action on climate change.
Case Studies: Real-World Applications of Satellite Imagery and GIS in Emission Tracking
To illustrate the power of satellite imagery and GIS in tracking greenhouse gas emissions, let’s explore a few case studies where these technologies have been applied in the real world.
Case Study 1: Tracking Methane Emissions from Oil and Gas Operations
Methane is a potent greenhouse gas with a global warming potential many times that of carbon dioxide. A significant source of methane emissions is the oil and gas industry, particularly from leaks in infrastructure such as pipelines, storage tanks, and wells. Detecting and addressing these leaks is critical for reducing overall methane emissions.
In 2019, a study conducted by the Environmental Defense Fund (EDF) used satellite imagery from the European Space Agency’s Sentinel-5P satellite to monitor methane emissions from oil and gas facilities in the Permian Basin, one of the largest oil-producing regions in the United States. The satellite data revealed several large methane plumes, indicating significant leaks from the infrastructure.
By integrating this satellite data with GIS, researchers were able to map the exact locations of the leaks and estimate the volume of methane being released. This information was then shared with industry operators and regulators, leading to targeted efforts to repair the leaks and reduce emissions.
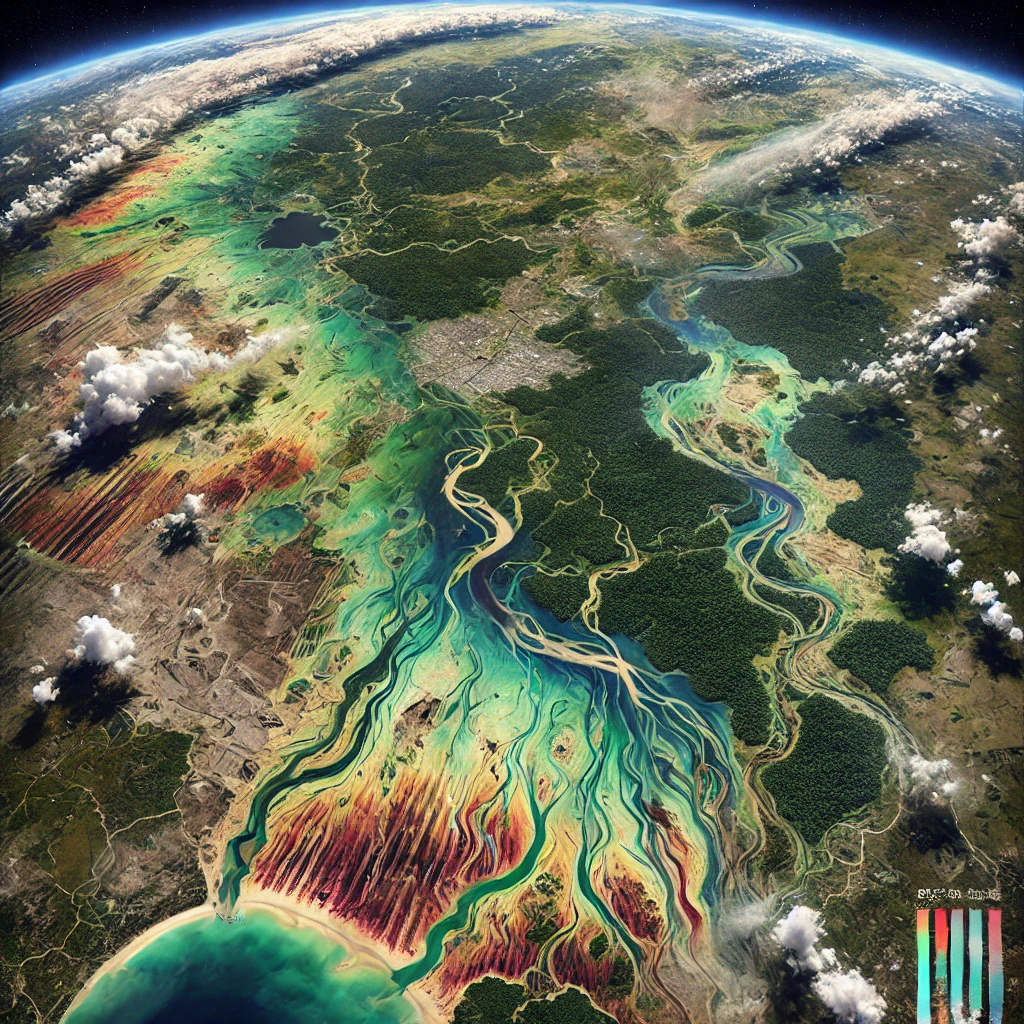
Case Study 2: Monitoring Carbon Emissions from Deforestation in the Amazon
The Amazon rainforest is often referred to as the “lungs of the Earth” because of its role in absorbing CO₂ from the atmosphere. However, deforestation and land-use changes in the Amazon are releasing significant amounts of carbon back into the atmosphere, contributing to global warming.
To monitor these emissions, the Brazilian National Institute for Space Research (INPE) uses satellite imagery from multiple sources, including NASA’s Landsat satellites and the European Space Agency’s Sentinel-2 satellites. These satellites capture detailed images of the Amazon, allowing researchers to track changes in forest cover over time.
By analyzing this satellite data with GIS, INPE has developed a system called PRODES (Program for the Estimation of Deforestation in the Amazon), which produces annual estimates of deforestation rates and associated carbon emissions. This information is used by the Brazilian government to enforce environmental regulations and by international organizations to assess the impact of conservation efforts.
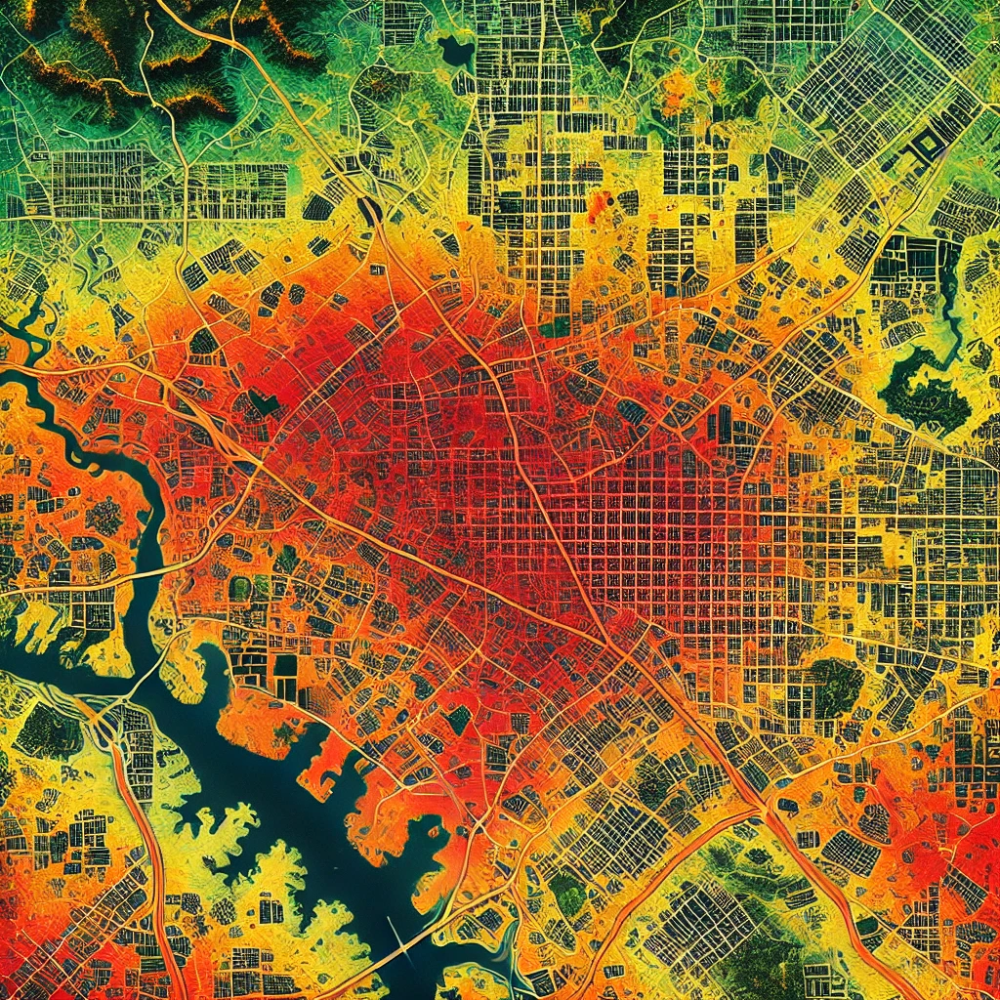
Case Study 3: Urban Emission Monitoring and Air Quality Management
Urban areas are major sources of greenhouse gas emissions, particularly from transportation, industrial activity, and energy production. Monitoring and managing these emissions is critical for improving air quality and reducing the urban contribution to climate change.
In cities like Los Angeles, researchers are using satellite imagery and GIS to monitor urban emissions in near real-time. For example, the Tropospheric Monitoring Instrument (TROPOMI) on the Sentinel-5P satellite provides daily measurements of air pollutants, including nitrogen dioxide (NO₂) and carbon dioxide (CO₂), which are closely linked to urban activities.
By integrating TROPOMI data with GIS, researchers can create detailed maps of air quality across the city, identifying areas with high concentrations of pollutants. These maps are used by city planners and policymakers to develop strategies for reducing emissions, such as promoting public transportation, implementing low-emission zones, and encouraging the use of renewable energy.
Challenges in Satellite and GIS-Based Emission Tracking
Despite the tremendous potential of satellite imagery and GIS for tracking greenhouse gas emissions, several challenges must be addressed to fully realize their benefits.
Data Accuracy and Calibration
One of the primary challenges is ensuring the accuracy of satellite-derived data. While modern satellites are highly sophisticated, their measurements can still be affected by various factors, including atmospheric conditions, sensor calibration, and the presence of other gases or particles in the atmosphere.
To address these issues, satellite data often needs to be calibrated and validated against ground-based measurements. This process can be complex and time-consuming, requiring collaboration between satellite operators, scientists, and monitoring stations on the ground.
Integration of Multiple Data Sources
Another challenge is the integration of data from multiple satellites and sensors. Different satellites may use different sensors, capture data at different resolutions, and operate in different orbits, leading to variations in the data they produce. Integrating these diverse data sources into a coherent and consistent dataset is essential for accurate emission tracking but can be technically challenging.
Advanced data fusion techniques and machine learning algorithms are increasingly being used to address these challenges, enabling the integration of data from multiple sources into a single, comprehensive dataset.
International Cooperation and Data Sharing
Greenhouse gas emissions are a global problem that requires international cooperation. However, the use of satellite imagery for emission tracking often involves data that is collected and controlled by individual countries or organizations. Ensuring that this data is shared openly and transparently is crucial for effective global monitoring and action.
International agreements and initiatives, such as the Paris Agreement and the Global Carbon Project, are essential for fostering cooperation and data sharing among nations. However, geopolitical tensions and issues related to data sovereignty can sometimes hinder these efforts.
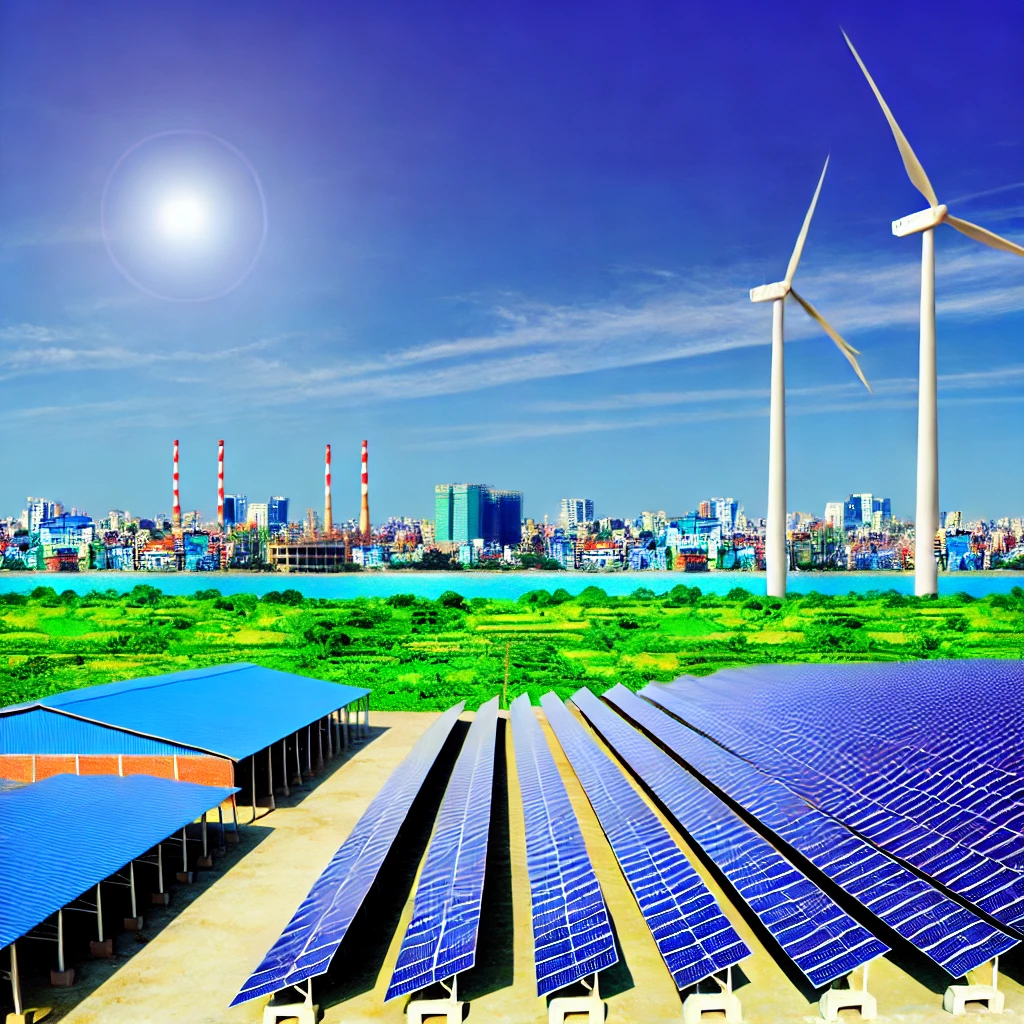
Technological and Financial Barriers
The deployment and operation of satellites and GIS systems require significant financial and technological resources. While large organizations and governments in developed countries may have the necessary resources, developing countries may face barriers to accessing and utilizing these technologies.
To address this, there is a growing emphasis on capacity-building initiatives, technology transfer, and the provision of open-access satellite data to ensure that all countries can participate in global emission tracking efforts.

The Future of Emission Tracking: Emerging Technologies and Innovations
As technology continues to advance, the future of emission tracking looks promising. Several emerging technologies and innovations are poised to enhance the capabilities of satellite imagery and GIS, offering even more accurate and detailed insights into greenhouse gas emissions.
Small Satellites and Constellations
The rise of small satellites, often referred to as “smallsats,” is revolutionizing the field of Earth observation. These satellites are much smaller and more affordable than traditional satellites, making it possible to launch large constellations of smallsats that can work together to provide continuous global coverage.
For example, companies like Planet Labs and Spire Global are deploying constellations of smallsats that can capture daily images of the entire Earth. These constellations can be used to monitor changes in land use, vegetation, and emissions in near real-time, offering a more dynamic and responsive approach to emission tracking.
Artificial Intelligence and Machine Learning
Artificial intelligence (AI) and machine learning (ML) are playing an increasingly important role in processing and analyzing satellite data. These technologies can automate the analysis of vast amounts of data, identify patterns and anomalies, and generate predictive models with greater accuracy and speed.
For example, AI algorithms can be used to detect methane leaks from satellite imagery automatically, reducing the need for manual analysis and enabling faster response times. Machine learning models can also be trained to predict future emissions based on historical data and environmental factors, providing valuable insights for policymakers and industry leaders.
Integration with Internet of Things (IoT)
The Internet of Things (IoT) refers to the network of interconnected devices that collect and exchange data. By integrating satellite data with IoT sensors on the ground, it is possible to create a more comprehensive and detailed picture of greenhouse gas emissions.
For example, IoT sensors placed in industrial facilities, agricultural fields, and urban areas can provide real-time data on emissions, which can be combined with satellite imagery to enhance the accuracy and resolution of emission maps. This integrated approach can help identify emission sources more precisely and enable more targeted mitigation efforts.
Blockchain for Data Transparency and Verification
Blockchain technology, best known for its use in cryptocurrencies, is being explored as a tool for ensuring the transparency and verification of emission data. By recording emission data on a decentralized and immutable blockchain, it is possible to create a transparent and tamper-proof record of emissions.
This technology could be particularly useful for carbon trading schemes, where accurate and verifiable emission data is essential. Blockchain could also enhance trust and cooperation among nations by providing a transparent record of emissions that is accessible to all parties.
Conclusion: The Path Forward
As the world confronts the urgent challenge of climate change, the need for accurate, real-time data on greenhouse gas emissions has never been more critical. Satellite imagery and GIS have emerged as powerful tools in this global effort, offering the ability to monitor emissions with unprecedented accuracy and detail.
While challenges remain, the continued advancement of these technologies, combined with international cooperation and innovation, holds the promise of a future where we can effectively track, manage, and reduce greenhouse gas emissions. By harnessing the power of satellite imagery, GIS, and emerging technologies, we can take meaningful steps toward a more sustainable and resilient world.
The path forward requires collaboration across borders, sectors, and disciplines. It requires a commitment to transparency, data sharing, and the equitable distribution of technological resources. Most importantly, it requires a shared vision of a world where we can live in harmony with our planet, ensuring a stable climate and a healthy environment for generations to come.